Mostbet Trading Assets -- Complete OTC Guide
Mostbet Trading offers a selection of OTC (over-the-counter) simulated assets for binary options betting. I traded on all available assets during my two-month testing period. Each asset has different payout percentages, price behavior characteristics, and volatility levels. This guide covers everything I observed about each one.
The critical word here is "OTC." None of these assets are connected to real financial markets. The "US 100 OTC" is not the Nasdaq 100 index. "EUR/USD OTC" does not reflect the actual euro-dollar exchange rate. These are synthetic price feeds generated by the platform's internal system. They're available 24 hours a day, 7 days a week -- because there's no real market with opening and closing hours.
Complete Asset Comparison Table
| Asset | Type | Payout Range | Volatility | My Trades | My Win Rate |
|---|---|---|---|---|---|
| US 100 OTC | Index | 87-92% | Medium | 89 | 52.8% |
| EUR/USD OTC | Currency | 85-90% | Low-Medium | 42 | 50.0% |
| GBP/JPY OTC | Currency | 85-88% | High | 28 | 50.0% |
| EUR/JPY OTC | Currency | 85-88% | High | 22 | 50.0% |
| BTC/USD OTC | Crypto | 82-88% | Very High | 18 | 50.0% |
| ETH/USD OTC | Crypto | 82-86% | Very High | 8 | 50.0% |
| Gold OTC | Commodity | 84-88% | Medium | 6 | 50.0% |
Data from 213 trades across 14 sessions, January-March 2026. Win rates for assets with fewer than 30 trades are statistically unreliable.
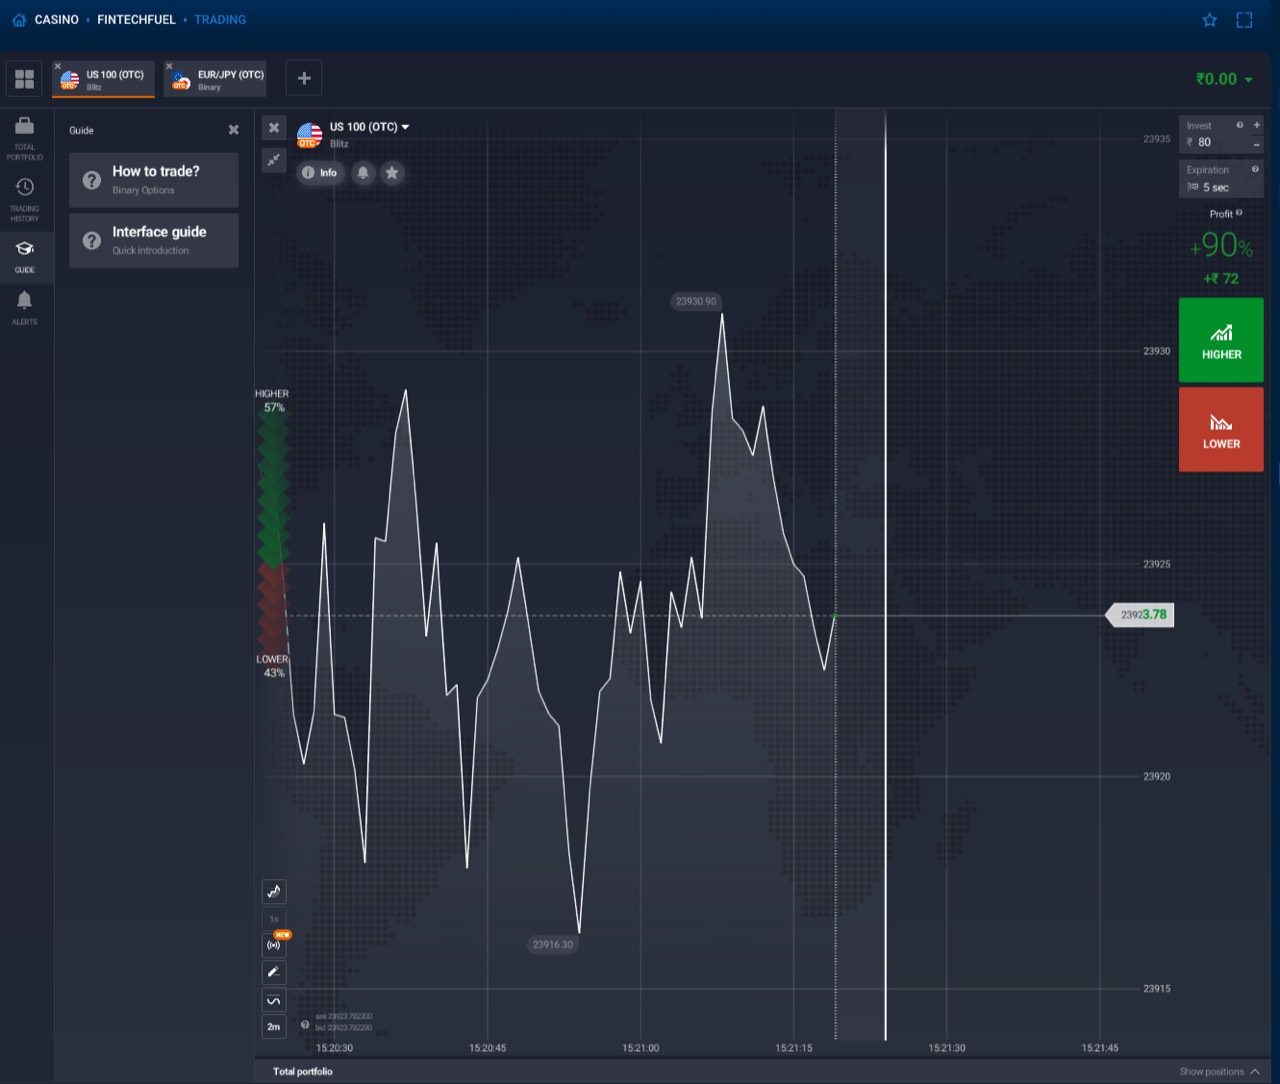
US 100 OTC -- My Recommended Starting Asset
US 100 OTC consistently offered the highest payout percentages during my testing -- usually between 87% and 92%. This is significant because higher payouts lower the break-even win rate. At 90% payout, you need 52.6% wins. At 85%, you need 54.1%. That 1.5% difference matters over hundreds of trades.
The price action on US 100 OTC was also the smoothest. It trends more consistently than the currency pairs, with less erratic spiking. My win rate on US 100 OTC was 52.8% across 89 trades -- the highest of any asset, though still barely above break-even for an 88% average payout.
If you're new to Mostbet Trading, start here. The combination of higher payouts and more readable price action makes it the best environment for learning the mechanics.
EUR/USD OTC -- Low Volatility, Lower Payouts
EUR/USD OTC behaves like a currency pair that drifts slowly. The price movements are relatively small per candlestick, making it feel more predictable. But "feeling predictable" and "being predictable" are different things on OTC markets.
My win rate on EUR/USD was exactly 50.0% across 42 trades -- pure coin flip territory. The lower volatility means smaller price swings, which translates to more trades expiring very close to the entry price. Several of my EUR/USD trades were decided by fractions of a pip. That randomness near the entry price is difficult to overcome with any strategy.
Payouts ranged from 85-90%, slightly lower than US 100 OTC. Unless there's a specific reason to trade currency pairs, I'd stick with US 100 OTC for the better payout rates.
GBP/JPY OTC and EUR/JPY OTC -- High Volatility Yen Crosses
The JPY cross pairs showed the most volatile price action. Sharp candles in both directions, sudden reversals, long wicks on the candlestick chart. In real forex, GBP/JPY is known as "the widow maker" for its volatility. Mostbet's OTC version captures that chaotic energy.
High volatility sounds like an opportunity -- bigger moves mean more decisive results, right? In practice, it meant more unpredictable outcomes. My win rate on both JPY crosses was 50.0%. The violent price swings didn't help prediction accuracy. They just made the chart more exciting to watch.
Payouts on these pairs were typically 85-88%, lower than US 100 OTC. Higher volatility, lower payouts, same 50/50 outcomes. Not a great combination.
Crypto OTC -- BTC/USD and ETH/USD
The crypto OTC pairs had the highest volatility and the lowest payouts. BTC/USD OTC ranged from 82-88% payout, and ETH/USD was 82-86%. These lower payouts push the break-even win rate up to 54-55%, making profitability significantly harder to achieve.
I only placed 26 combined trades on crypto assets before concluding they weren't worth the higher difficulty. The wild price swings made chart reading essentially useless, and the lower payouts punished losses more severely. Unless you specifically enjoy the heightened variance, there's no mathematical reason to trade crypto OTC over US 100 OTC.
Gold OTC -- Limited Availability
Gold OTC appeared intermittently during my testing period -- it wasn't always available as an option. When present, it behaved similarly to US 100 OTC in terms of price smoothness but with slightly lower payouts (84-88%).
I only managed 6 trades on Gold OTC, which is far too few to draw any conclusions about win rate or behavior patterns. If it's available and offering payouts above 87%, it's worth considering. Otherwise, stick with US 100 OTC.
Asset Correlation -- Do They Move Together?
In real financial markets, assets show measurable correlations. EUR/USD and GBP/USD tend to move in the same direction. Gold often moves inversely to the US dollar. These correlations exist because the same economic forces affect related assets.
On Mostbet's OTC markets, I observed very weak correlation between assets. EUR/USD OTC and EUR/JPY OTC occasionally moved in the same direction (they share the EUR component), but the correlation was inconsistent. US 100 OTC and the currency pairs showed essentially no relationship.
This weak correlation means you can't use one asset's movement to predict another's direction. Each OTC feed operates relatively independently. The synthetic price generators don't seem to share a common underlying model.
Best Assets for Beginners
Based on my testing, here's my ranking for new traders:
- US 100 OTC -- Highest payouts, smoothest price action, most popular
- EUR/USD OTC -- Low volatility, good for practicing patience
- Gold OTC -- When available, decent payouts and moderate volatility
Assets I'd avoid as a beginner:
- GBP/JPY OTC, EUR/JPY OTC -- Too volatile, lower payouts
- BTC/USD OTC, ETH/USD OTC -- Lowest payouts, highest volatility, hardest break-even targets
How I Choose an Asset for Each Session
My asset selection process at the start of every session follows three steps:
- Check all available payouts. Open the asset picker and note the current payout percentage for each asset. This takes 30 seconds and can save you significant money over a session.
- Select the highest payout. If US 100 OTC shows 91% and EUR/USD shows 86%, trade US 100. The 5% difference shifts your break-even win rate from 52.4% to 53.8%. Over 20 trades, that gap represents roughly $10 in expected losses.
- Glance at recent price action. If the chart shows extreme choppiness (rapid alternating candles with no direction), I may wait a few minutes for the price behavior to settle. If it shows a more readable pattern (directional movement or clear ranges), I start trading.
Step 1 and 2 are non-negotiable. Step 3 is somewhat subjective and has debatable value on OTC feeds, but it helps me enter each session with a sense of the current market "character."
Asset Switching During a Session
I experimented with switching assets mid-session -- for example, moving from US 100 OTC to EUR/USD OTC after a losing streak. My rationale was that a "change of scenery" might break a bad streak. The reality: it made no difference to my results. Losing streaks are a product of random variance, not of a specific asset being "against you."
The one valid reason to switch assets mid-session is if the payout on your current asset drops significantly. I once saw US 100 OTC drop from 90% to 85% during a session. Switching to EUR/USD at 88% was the mathematically correct move.
Otherwise, stick with your chosen asset. Switching adds complexity without adding value. Each OTC feed has slightly different price behavior patterns, and you're better off getting familiar with one asset's rhythms than jumping between multiple feeds.
Payout Fluctuation -- Why Rates Change
The payout percentage on each asset isn't fixed. I observed fluctuations of 3-5% on the same asset across different sessions and times of day. US 100 OTC sometimes offered 92% and other times dropped to 87%.
The factors that seemed to influence payout rates:
- Time of day: Payouts occasionally differed between peak and off-peak hours
- Timeframe selected: Shorter timeframes sometimes had slightly different payouts than longer ones
- Platform adjustments: The platform appears to dynamically adjust payouts
Before placing a trade, always check the current payout percentage. A 3% difference between 87% and 90% shifts your break-even win rate from 53.5% to 52.6%. Over 100 trades, that difference changes your expected loss by roughly $10 per $100 wagered.
Try all assets in demo mode first. Find the one that suits your trading style before risking real money.
Open Mostbet Trading →